How to Build a Trading Plan: Entry Rules, Stop Loss, and Risk Management
Most trading losses don't come from bad analysis. They come from decisions made in the moment: entering because a stock is moving, moving a stop because the trade "needs more room", doubling up after a loss. A trading plan moves those decisions out of the moment and into a calm, written document. This guide explains what a trading plan contains, how to write entry rules, where to place stop-losses, and how to manage risk so that no single trade or bad week can do serious damage.
What is a trading plan?
A trading plan is a written set of rules covering what you trade, when you trade, how you enter and exit, how much you risk and how you review your results. It should be specific enough that someone else could follow it and take the same trades.
1. Define your goals and constraints
- Capital: how much you will trade with, and how much you can afford to lose without it affecting your life.
- Time: whether you can watch the market all day, a few hours, or only after hours. This decides whether intraday, swing or positional trading suits you.
- Style: the instruments you trade, such as stocks, index futures or options, and the timeframes you use.
2. Write clear entry rules
An entry rule should answer three questions: what market condition must be in place, what specific trigger causes the entry, and what filters keep you out.
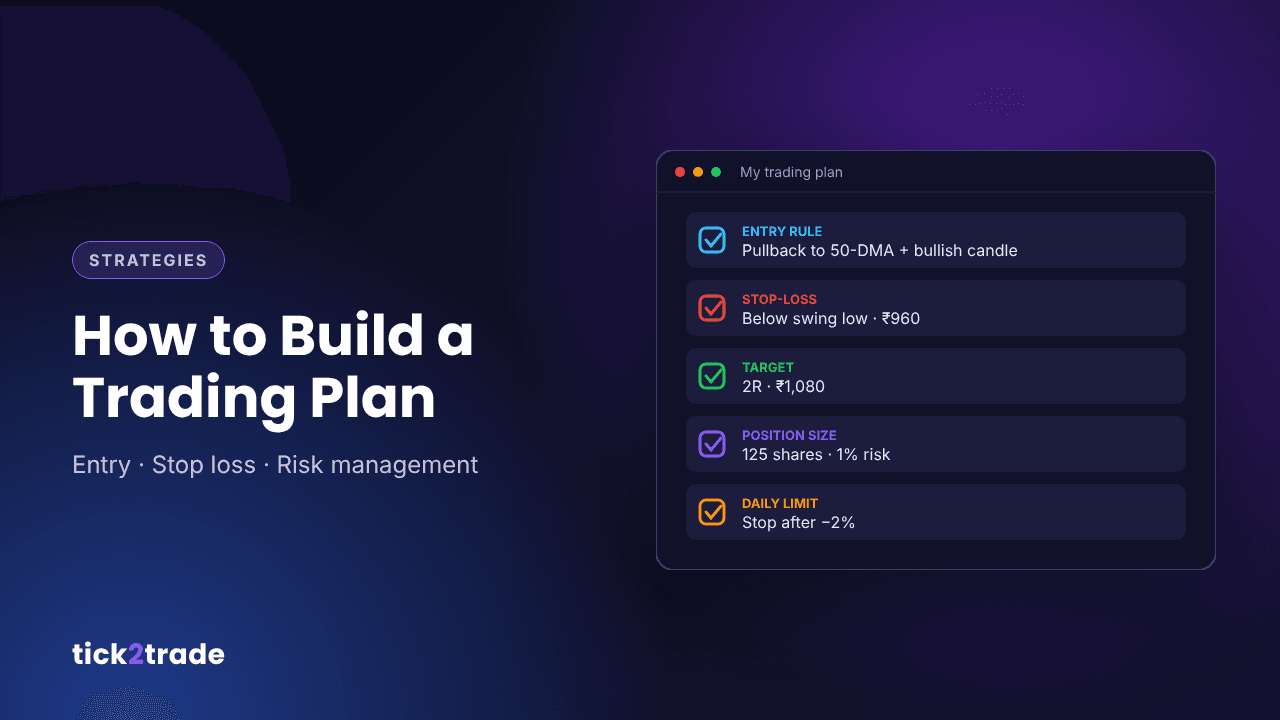
Example: pullback in an uptrend
- Condition: stock is above its 200-day moving average and the 50-day is above the 200-day.
- Trigger: price pulls back to the 50-day moving average and forms a bullish candle, such as a hammer or bullish engulfing, on the daily chart.
- Entry: buy above the high of the trigger candle.
- Filters: no entry within two days of results; average daily volume above your liquidity threshold.
Avoid vague rules like "buy when it looks strong". If a rule can't be checked objectively, you will bend it. For help reading patterns, see how to read candlestick charts.
3. Set your stop-loss
The stop-loss is the price at which your trade idea is proven wrong. Place it based on the chart, not on how much you are willing to lose; the amount you lose is controlled by position size.
- Structure-based stops: just beyond the swing low (for a long) or swing high (for a short), or beyond the support or resistance zone you are trading from.
- Volatility-based stops: a multiple of the average true range (ATR) away from entry, so that normal noise doesn't trigger the stop.
- Time-based stops: exit if the trade hasn't moved as expected within a set number of candles or days.
Once placed, a stop should only ever be moved in the direction of the trade, never further away.
4. Define targets and exits
- Fixed reward-to-risk: for example, a target at twice the distance to the stop (2R).
- Level-based targets: the next significant resistance for a long, or support for a short.
- Trailing stops: follow the trade with a trailing stop to capture extended moves.
- Partial exits: book part of the position at the first target and trail the rest.
5. Size every position
Position sizing is where risk management actually happens. A common rule is to risk a fixed percentage of capital, often 1% or less, on each trade.
Example: with capital of ₹5,00,000 and a 1% risk rule, the maximum loss per trade is ₹5,000. If you buy a stock at ₹1,000 with a stop at ₹960, the risk per share is ₹40. Position size = ₹5,000 ÷ ₹40 = 125 shares.
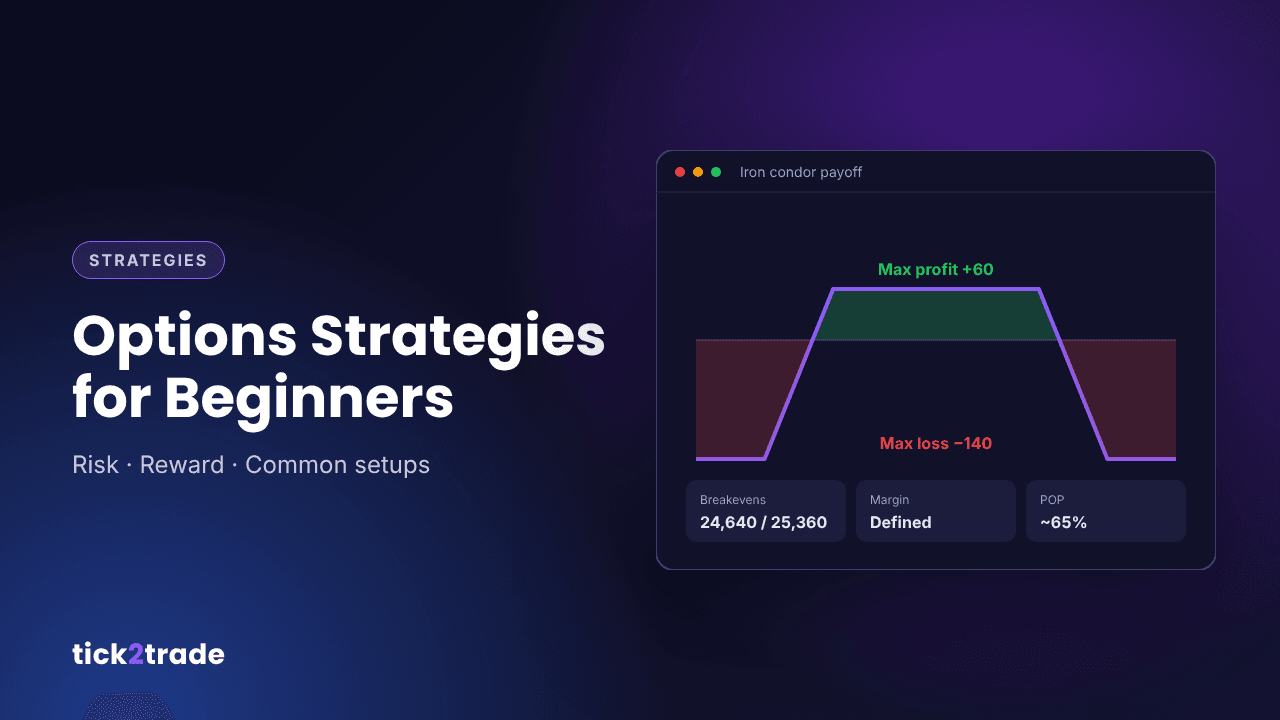
For options, use the maximum loss of the position rather than the premium alone, especially for strategies that involve selling options. See options strategies for beginners.
6. Set limits beyond a single trade
- Daily loss limit: stop trading for the day after losing a set amount, such as 2% to 3% of capital.
- Maximum open risk: cap the total risk across all open positions.
- Correlation: five long positions in banking stocks are closer to one big trade than five separate ones.
- Drawdown rule: reduce size or pause and review after a set drawdown, such as 10%.
7. Keep a journal and review
Record every trade: setup, entry, stop, target, size, outcome and whether you followed the plan. Each week, review win rate, average win versus average loss and rule-breaks. Change the plan deliberately after review, never in the middle of a losing day. Before trading a new plan with real money, test it with paper trading.
A one-page plan template
- Markets and timeframes:
- Setups I trade:
- Entry trigger and filters:
- Stop-loss method:
- Target and exit method:
- Risk per trade:
- Daily loss limit and maximum open risk:
- Review schedule:
How Tick2Trade helps you follow your plan
- Find setups systematically. Turn your entry conditions into saved screens and receive the results daily. See what is a stock screener.
- Stops and targets at entry. Bracket orders attach a stop-loss and target to every trade, placed straight from the chart.
- Basket-level risk for options. Set a stop-loss, target and trailing stop on a whole multi-leg position, and see max loss and margin before you place it.
- Rules that act for you. Conditional entry and exit rules based on price, IV, P&L and time help you execute the plan consistently.
- Practise before you commit. Tick-by-tick chart replay with virtual trades lets you rehearse your plan on past sessions.
Risk disclosure: Trading in securities and derivatives involves risk. SEBI studies have found that about 9 out of 10 individual F&O traders incurred net losses. The examples in this article are for education only and are not investment advice. Tick2Trade is a brand of Besseggen InfoTech LLP, SEBI Reg. No. INZ000213450.