A candlestick chart is the default view on almost every trading platform, yet many traders use it only to see whether the market is up or down. Each candle actually records a small battle between buyers and sellers, and a series of candles shows who is winning, where they are fighting and when control is changing hands. This guide explains how to read a single candle, the patterns worth knowing, how to identify trends and key levels, and how to avoid the most common mistakes.
Anatomy of a candlestick
Every candle summarises price over one period, whether that is one minute, one hour or one day. It is built from four prices:
- Open: the first traded price of the period.
- High: the highest price reached.
- Low: the lowest price reached.
- Close: the last traded price of the period.
The thick part of the candle, the body, spans the open and the close. If the close is above the open, the candle is bullish, usually shown in green. If the close is below the open, it is bearish, usually shown in red. The thin lines above and below the body, the wicks or shadows, show how far price travelled before it was pushed back.
What the shape tells you
- Long body, short wicks: one side was in control from open to close. A strong, decisive period.
- Small body, long wicks: both sides pushed hard and neither won. Indecision.
- Long lower wick: sellers drove price down, but buyers bought it back. Rejection of lower prices.
- Long upper wick: buyers drove price up, but sellers pushed it back. Rejection of higher prices.
A single candle is a clue, not a conclusion. Its meaning depends on where it appears and what came before it.
Single-candle patterns
- Doji. Open and close are almost equal. It signals indecision, and is most interesting after a long run in one direction, when it can mean momentum is fading.
- Hammer. A small body near the top of the range with a lower wick at least twice the length of the body, appearing after a decline. Sellers pushed price down and buyers took it back, a possible sign of a bottom.
- Shooting star. The mirror image of a hammer: a small body near the bottom of the range with a long upper wick, appearing after a rally. A possible sign of a top.
- Marubozu. A long body with little or no wick. Strong conviction in the direction of the candle.
Multi-candle patterns
- Bullish and bearish engulfing. The second candle's body completely covers the body of the first, in the opposite direction. A bullish engulfing after a decline, or a bearish engulfing after a rally, suggests control has switched.
- Morning star and evening star. A three-candle reversal: a strong candle in the trend direction, a small indecisive candle, then a strong candle the other way that closes well into the first candle's body.
- Inside bar. A candle whose entire range sits within the previous candle's range. It shows contraction, and a break of the inside bar's high or low often marks the next move.
- Three white soldiers and three black crows. Three consecutive strong candles in the same direction, each closing near its extreme. A sign of sustained pressure.
Reading trends with candles
Patterns matter less than the trend they appear in. A simple way to read the trend:
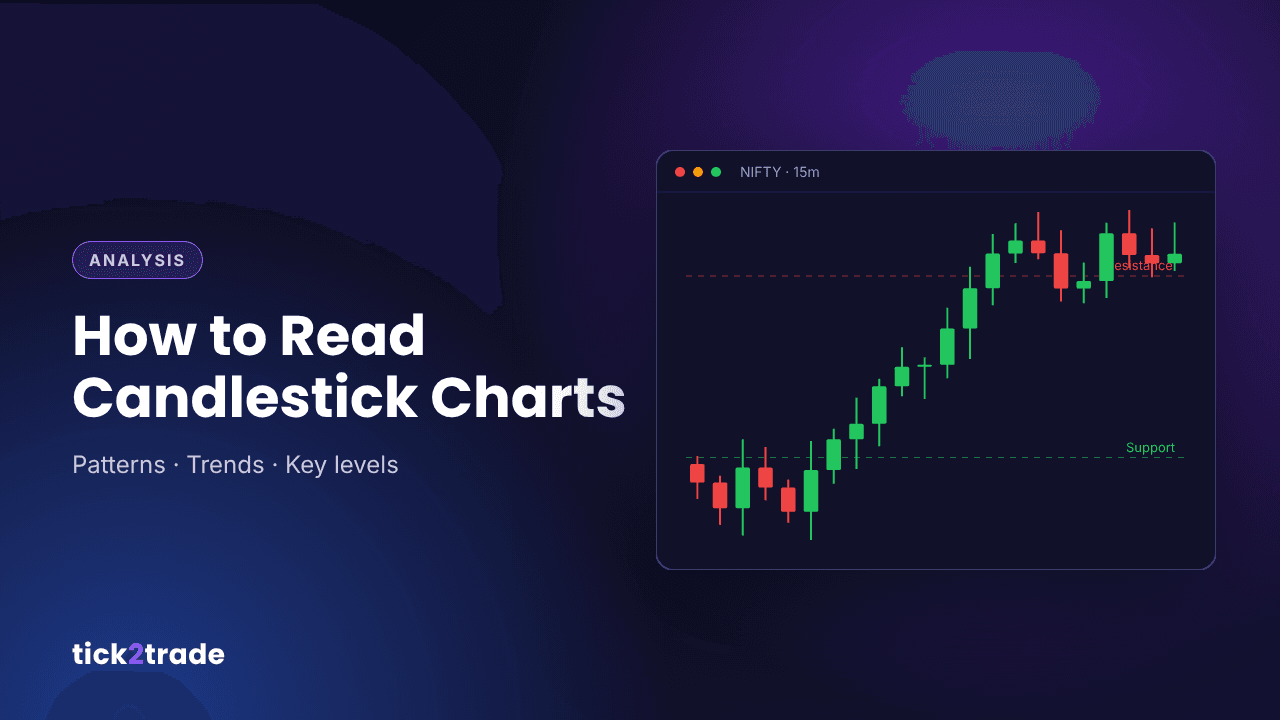
- Uptrend: higher highs and higher lows. Bullish candles tend to be larger than bearish ones, and pullbacks are shallow.
- Downtrend: lower highs and lower lows, with bearish candles dominating.
- Range: highs and lows roughly level, with candles of mixed colour and size.
A hammer in a strong downtrend is a weaker signal than a hammer at the bottom of a range or at a pullback within an uptrend. Trade patterns in the direction of the larger trend wherever possible.
Finding key levels
Candles are most informative at levels where price has reacted before:
- Support: a zone where falling prices have repeatedly stopped and turned higher.
- Resistance: a zone where rising prices have repeatedly stalled.
- Previous day's high, low and close: widely watched by intraday traders.
- Round numbers: levels such as 25,000 on NIFTY attract orders and attention.
Mark levels as zones rather than single prices. Then watch the candles that form when price reaches them. Long wicks rejecting a level, or an engulfing candle forming at it, carry far more weight than the same candle in the middle of nowhere. For options traders, the strikes with the highest open interest often line up with these zones; see our guide to reading an option chain.
Choosing a timeframe
The same market can look bullish on a 5-minute chart and bearish on a daily chart. A practical approach is to use two or three timeframes:
- A higher timeframe to define the trend and key levels.
- A trading timeframe to find setups.
- A lower timeframe to time entries and place stops precisely.
For example, a swing trader might use the weekly, daily and hourly charts, while an intraday trader might use the hourly, 15-minute and 3-minute charts.
Common mistakes
- Trading patterns in isolation. A pattern without a trend or a level behind it is a coin flip.
- Acting before the candle closes. A hammer can turn into a bearish candle in the last minutes of the period. Wait for the close.
- Ignoring volume. A reversal pattern on heavy volume is more meaningful than one on thin volume.
- No exit plan. Every pattern can fail. Decide where you are wrong, usually beyond the pattern's high or low, before you enter.
How Tick2Trade's charts help you read candles
- Candles built from every trade. Tick2Trade's advanced charts use tick-by-tick data, so the highs, lows and wicks you see reflect every trade, not periodic snapshots. Learn more in our guide to Tick2Trade's trading charts.
- Timeframes that fit your style. Use second-based candles for precise entries or custom timeframes such as 2 or 7 minutes.
- Practise on past sessions. Replay any session tick by tick and place virtual trades to test how you read patterns before risking money.
- Trade from the chart. Tick2Trade is a SEBI-registered broker's own terminal, so you can place an order, including a bracket order with a stop-loss and target, straight from the chart you are reading.
Risk disclosure: Investments in securities are subject to market risks. Candlestick patterns are probabilistic and frequently fail. This article is for education only and is not investment advice. Tick2Trade is a brand of Besseggen InfoTech LLP, SEBI Reg. No. INZ000213450.