How to Read an Option Chain: Strike Price, Call, Put, and Open Interest
The first time you open an option chain, it looks like a spreadsheet that someone forgot to label. Dozens of rows, numbers on both sides, and terms like OI, IV and PCR. Once you know what each part means, it becomes one of the most useful screens in trading: a live map of where traders are positioned and what the market expects. This beginner's guide explains the building blocks of an option chain, strike price, calls, puts and open interest, with simple examples.
First, what is an option?
An option is a contract that gives the buyer the right, but not the obligation, to buy or sell an underlying asset at a fixed price on or before a fixed date. In India, index options such as NIFTY and BANKNIFTY, and options on F&O stocks, trade on NSE.
- The buyer pays a price called the premium. Their maximum loss is that premium.
- The seller (also called the writer) receives the premium and takes on the obligation. Their potential loss can be much larger than the premium they collect.
The layout of an option chain
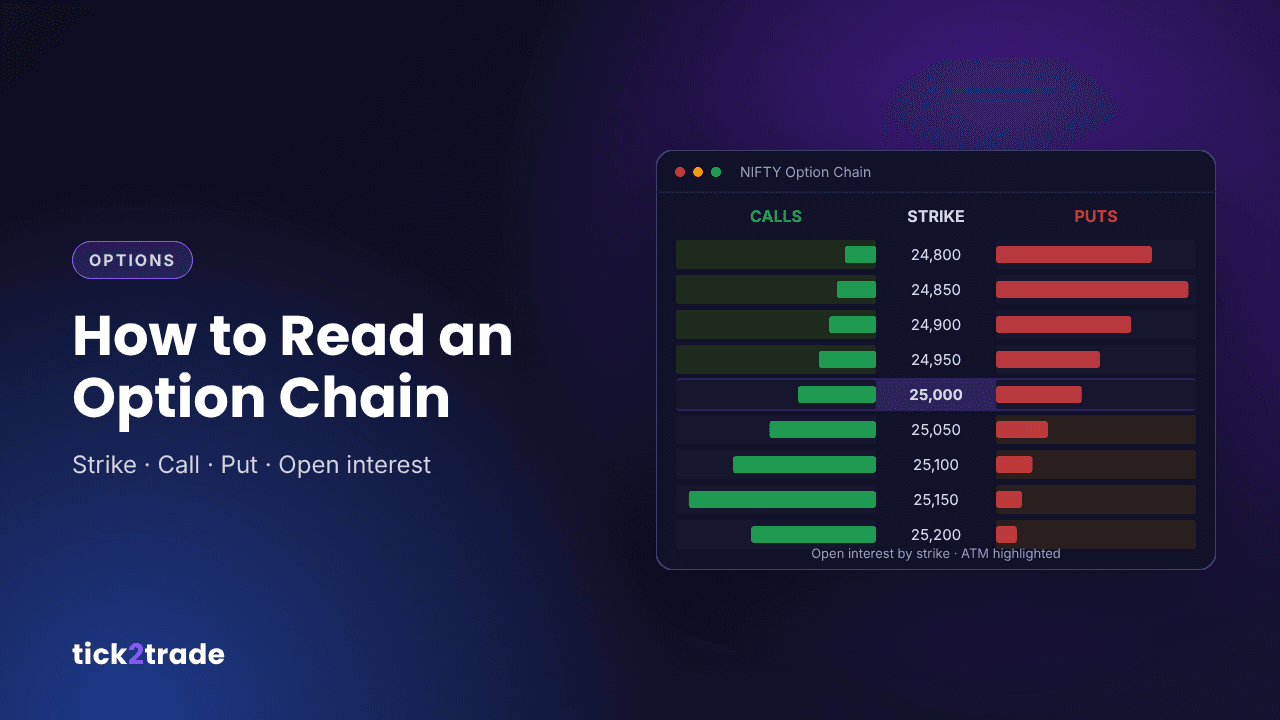
An option chain lists every option available on an underlying for a chosen expiry date. It has three parts:
- Strike prices run down the middle.
- Calls are on the left.
- Puts are on the right.
Each row is a pair of contracts, one call and one put, with the same strike and expiry.
Strike price
The strike price is the price at which the option can be exercised. Strikes are set at fixed intervals, for example every 50 points on NIFTY.
Where a strike sits relative to the current market price determines whether it is in the money, at the money or out of the money:
| Call option | Put option | |
|---|---|---|
| In the money (ITM) | Strike below spot | Strike above spot |
| At the money (ATM) | Strike nearest spot | Strike nearest spot |
| Out of the money (OTM) | Strike above spot | Strike below spot |
Example: with NIFTY at 25,000, the 24,800 call is ITM, the 25,000 call is ATM and the 25,200 call is OTM. For puts it is the reverse. ITM options are more expensive because they already have intrinsic value. OTM options are cheaper but need a bigger move to pay off.
Call options
A call gives the buyer the right to buy the underlying at the strike price.
- Call buyers expect the price to rise. If NIFTY expires at 25,300, the 25,000 call is worth 300 points. If the buyer paid 120, their profit is 180 points per unit.
- Call sellers expect the price to stay below their strike. If NIFTY expires below 25,000, the call expires worthless and the seller keeps the 120 points.
Put options
A put gives the buyer the right to sell the underlying at the strike price.
- Put buyers expect the price to fall. If NIFTY expires at 24,700, the 25,000 put is worth 300 points.
- Put sellers expect the price to stay above their strike, and keep the premium if it does.
Open interest (OI)
Open interest is the number of option contracts that are currently open, meaning they have been created and not yet closed or expired. It is different from volume, which counts every trade during the day. Read more in open interest vs volume.
- OI rises when new positions are created: a new buyer and a new seller.
- OI falls when existing positions are closed.
How traders read OI
- High call OI above the market is often read as resistance, because call writers are betting price stays below that strike.
- High put OI below the market is often read as support, because put writers are betting price stays above that strike.
- OI change during the day shows where fresh positions are being built or unwound.
Treat these as zones of interest, not hard walls. OI can shift quickly, especially near expiry.
Other columns you will see
- LTP: the last traded price (premium) of the option.
- Bid and ask: the best prices buyers and sellers are offering. A wide gap means poor liquidity.
- IV: implied volatility, the market's expectation of future movement. Higher IV means more expensive options.
- PCR: the put-call ratio, total put OI divided by total call OI, used as a sentiment gauge.
A simple first routine
- Choose the underlying and the nearest expiry.
- Find the ATM strike, where the market is trading.
- Identify the call strike with the highest OI above spot and the put strike with the highest OI below spot. These give a rough expected range.
- Check OI change to see whether those positions are growing or shrinking today.
- Check bid-ask spreads before choosing a strike to trade.
Ready to go further? Our advanced option chain guide covers buildup, PCR, max pain, Greeks and a five-step pre-trade routine.
How Tick2Trade's option chain helps beginners
- ITM, ATM and OTM made clear. A highlighted line marks where the underlying is trading.
- Buildup labelled for you. Every strike shows whether OI change is long buildup, short buildup, short covering or long unwinding.
- All expiries on one screen, each with its own PCR, ATM IV and days to expiry.
- Learn, then act, in one place. Tick2Trade is a SEBI-registered broker's own terminal, so you can click strikes to build a strategy and place every leg from the same screen.
Risk disclosure: Trading in futures and options involves substantial risk. SEBI studies have found that about 9 out of 10 individual F&O traders incurred net losses. Premiums in this article are illustrative. This article is for education only and is not investment advice. Tick2Trade is a brand of Besseggen InfoTech LLP, SEBI Reg. No. INZ000213450.