Open Interest vs Volume: Key Differences Every Options Trader Should Know
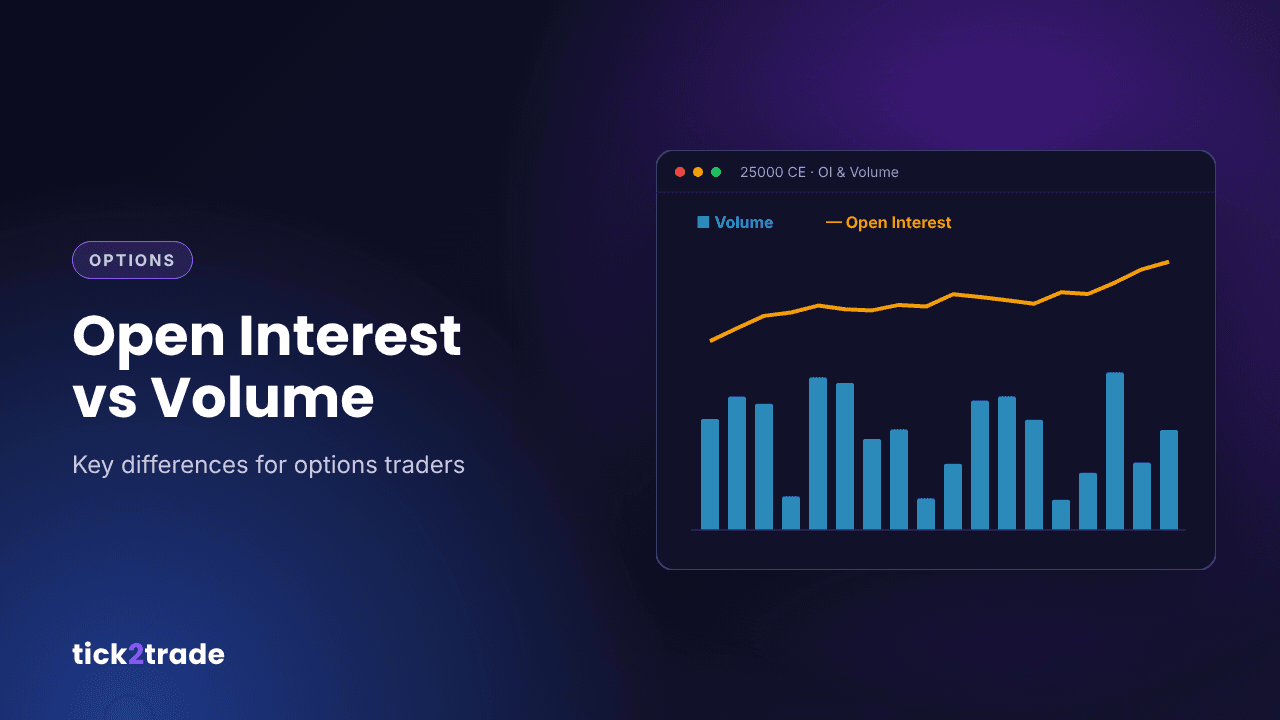
Open interest and volume sit next to each other on every option chain, and both get described as measures of "activity". But they answer very different questions. Volume tells you how much trading happened today. Open interest tells you how many positions are still open. Confusing the two leads to some of the most common misreadings in options trading. This guide explains the difference, how each changes, and how to use them together.
What is volume?
Volume is the number of contracts traded during a period, usually the current session. Every trade adds to volume, whether it opens a new position or closes an existing one.
- Volume resets to zero at the start of every session.
- It only ever goes up during the day.
- It measures activity and liquidity: how actively a contract is being traded right now.
What is open interest?
Open interest (OI) is the total number of contracts that are outstanding: opened and not yet squared off, exercised or expired.
- OI carries over from one day to the next.
- It can go up or down during the day.
- It measures commitment: how much capital is tied up in a strike.
How a trade affects each
Every trade has a buyer and a seller, and each of them is either opening or closing a position. That determines what happens to OI:
| Buyer | Seller | Volume | Open interest |
|---|---|---|---|
| Opens a new position | Opens a new position | Rises | Rises |
| Opens a new position | Closes an existing position | Rises | Unchanged |
| Closes an existing position | Opens a new position | Rises | Unchanged |
| Closes an existing position | Closes an existing position | Rises | Falls |
Volume always rises with a trade. OI only changes when both sides are opening, or both are closing.
Key differences at a glance
- What it counts: volume counts trades; OI counts open positions.
- Time frame: volume is for the session; OI is cumulative.
- Direction: volume only increases during the day; OI can increase or decrease.
- What it tells you: volume shows liquidity and interest today; OI shows where positions have been built up.
Why the difference matters
High volume, low OI
Lots of trading but few positions staying open. This is typical of intraday activity: traders entering and exiting within the session. It shows interest but not commitment.
High OI, low volume
Many positions open, but little trading today. Traders are holding. Strikes like this often act as reference levels, because a large amount of money is riding on price staying on one side of them.
Rising OI with rising volume
New positions are being created actively. This is the strongest signal that a level or view is attracting fresh money.
Falling OI with high volume
Positions are being closed in large numbers. This often accompanies sharp moves, such as short covering when call writers are forced out during a rally.
Combining OI, volume and price
The most useful reading comes from looking at price change and OI change together:
- Price up, OI up: long buildup. New buyers are entering.
- Price down, OI up: short buildup. New writers are entering.
- Price up, OI down: short covering. Writers are exiting.
- Price down, OI down: long unwinding. Buyers are booking out.
Volume then tells you how strongly each of these is happening. A short buildup on heavy volume carries more weight than one on light volume.
Practical uses
- Choosing strikes: trade strikes with good volume and tight bid-ask spreads, so you can enter and exit cleanly.
- Mapping levels: use the highest call and put OI strikes as a rough expected range, and watch OI change to see whether those levels are strengthening.
- Confirming moves: a breakout through a high-OI call strike with OI falling at that strike (short covering) and high volume is more convincing than a quiet drift.
Common mistakes
- Reading high OI as bullish or bearish on its own. OI has no direction until you pair it with price.
- Treating volume as a sign of new positions. Much of it may be closing trades.
- Ignoring expiry effects. OI in the near expiry falls sharply in the final days as positions are closed or rolled.
How Tick2Trade helps you read OI and volume
- Buildup labelled on every strike. The option chain marks long buildup, short buildup, short covering and long unwinding automatically.
- OI analysis tools. Move from the chain into dedicated OI analysis and the multi-strike chart to see how positioning has changed over time.
- All expiries together, each with its own PCR, ATM IV and days to expiry.
- Trade where you analyse. Tick2Trade is a SEBI-registered broker's own terminal, so the strike you identify can be traded from the same screen. See our advanced option chain guide for more.
Risk disclosure: Trading in futures and options involves substantial risk. SEBI studies have found that about 9 out of 10 individual F&O traders incurred net losses. This article is for education only and is not investment advice. Tick2Trade is a brand of Besseggen InfoTech LLP, SEBI Reg. No. INZ000213450.