5 Screener Setups to Find Intraday Breakout Stocks Before the Market Moves
Breakouts happen fast. By the time a stock shows up on a news channel or a social feed, most of the move is already over. The traders who catch it early are the ones who were already watching the right shortlist. A good screener builds that shortlist for you. Here are five practical screener setups for finding intraday breakout candidates, and how to turn a scan result into a trade.
Before you scan: the tradability filter
Every setup below should start with the same base filter so you only see stocks you can actually trade:
- Price above ₹100 to avoid very low-priced, erratic counters.
- Average daily volume above 5 lakh shares for easy entry and exit.
- F&O stocks only, if you prefer the deepest liquidity.
Setup 1: Opening range breakout
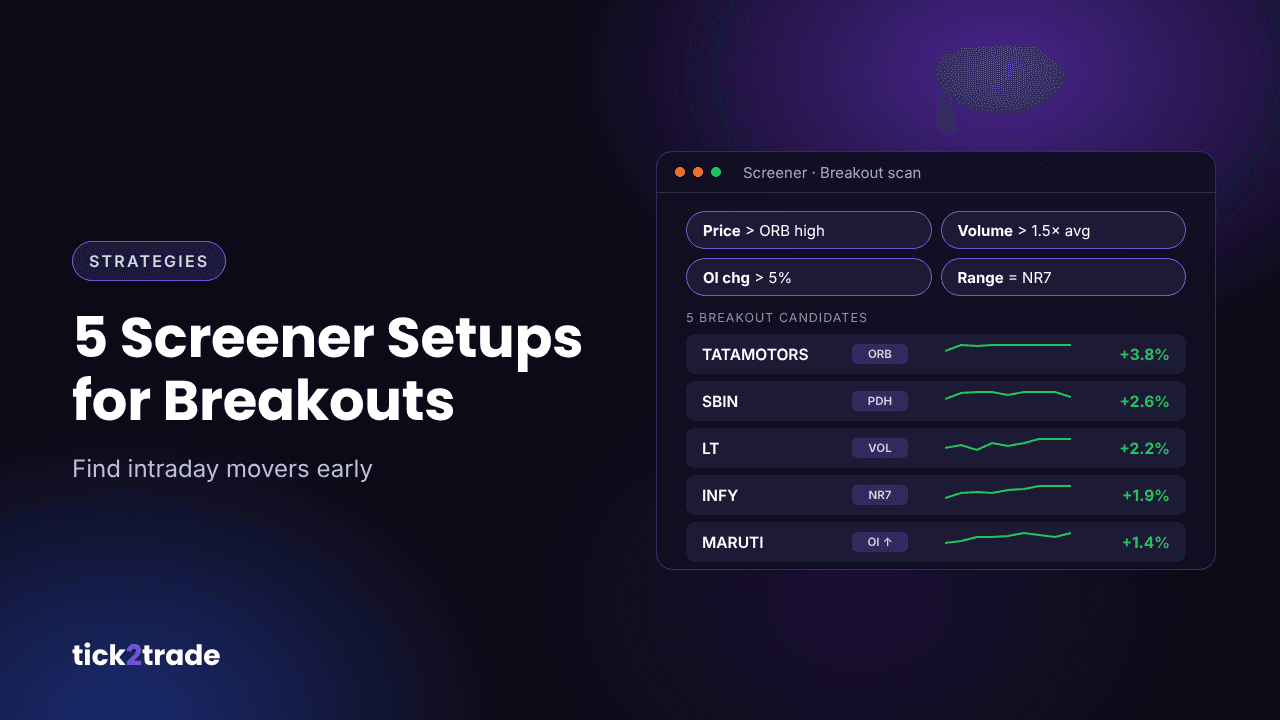
Conditions: price above the high of the first 15 minutes, volume in the current candle more than 1.5x the average.
Why it works: the opening range captures the market's first view of the day. A move above it with strong volume shows that buyers are in control.
Setup 2: Previous-day high breakout
Conditions: price crossing above yesterday's high, gap at open less than 1%.
Why it works: yesterday's high is a level that many traders watch. Filtering out large gaps keeps you away from stocks that have already moved too much.
Setup 3: Volume shocker
Conditions: today's volume already above 2x the 20-day average volume, price change above 1.5%.
Why it works: unusual volume usually means institutions or news are involved. Price plus volume together is far more reliable than price alone.
Setup 4: Narrow range squeeze
Conditions: yesterday's range is the narrowest of the last 7 days (NR7), price within 1% of yesterday's high or low.
Why it works: periods of low volatility tend to be followed by expansion. NR7 stocks are coiled springs; you simply wait for the side they break.
Setup 5: Open interest build-up in F&O stocks
Conditions: price up more than 1%, futures open interest up more than 5% on the day.
Why it works: rising price with rising OI signals fresh long positions rather than short covering, which often supports a more sustained move.
From scan result to trade plan
- Open the chart. Confirm the breakout level visually and check for nearby resistance.
- Define your stop. A common choice is below the breakout candle or the opening range low.
- Size the position. Risk a fixed percentage of capital, not a fixed number of shares.
- Set an alert. If the stock has not broken out yet, set a price alert at the level instead of staring at the screen.
- Add it to a watchlist. Keep today's candidates in one place so you can track them through the session.
Common mistakes
- Chasing a stock that is already 4–5% up with no clear stop.
- Ignoring the broader market. Breakouts fail more often when NIFTY is falling.
- Running too many scans at once and acting on none of them.
Try it on Tick2Trade
Tick2Trade's Screener, charts, alerts and watchlists sit in one terminal, so you can go from a scan to a chart to an order without switching apps. Open the Tick2Trade chart terminal and build your first breakout scan today.
Disclaimer: This article is for educational purposes only and is not investment advice. Trading in securities and derivatives involves risk.